Open a patient's chart note.
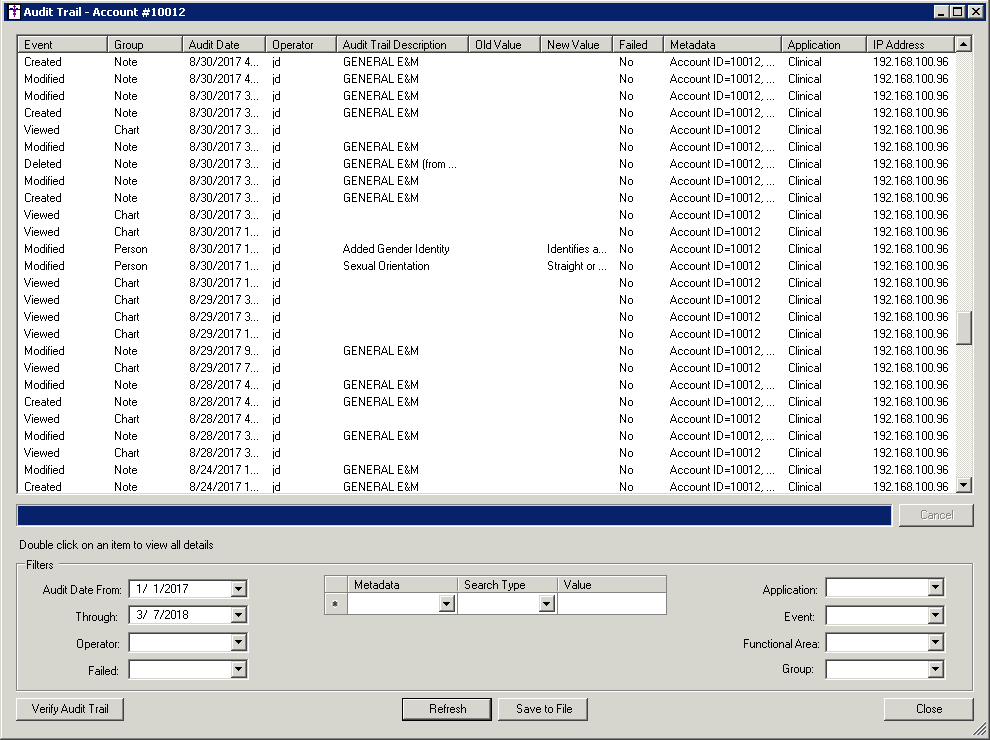
Modify the Audit
Date From and Through fields
if you want to view audit events for a particular date range.
NOTE: The system will not allow you to filter an audit query for greater
than a 12 month period. A warning icon will appear next to the Audit Date
From field when are range greater than 12 months has been entered. If
you mouse over the warning icon, a message will appear outlining the warning.
Select an Operator
to view audit events for a specific user.
In the Failed field, select Yes
or No if you want to specify whether
to just view audit events that failed, or did not fail. Leaving this field
blank shows both events that failed and events that did not fail.
The Metadata and Value fields allow you to select
addition data items to filter on. Select a Metadata
item, and enter a corresponding Value
for that item, if applicable.
NOTE: The system will not allow you to use less than three characters
in the Value field when utilizing the Contains or Starts With search type
when configuring metadata. A warning icon will blink next to the Value
field when it contains less than three digits. If you mouse over the warning
icon, a message will appear outlining the warning.
In the Application field, select the particular
Application (Clinical, Health
Portal, Practice Manager) you would like to view audit events for. Leaving
this field blank will display audit events for all applications.
Select an Event
if you want to specify a certain audit type (i.e., deleted items) to be
displayed.
Select a Functional
Area if you want to specify a particular area within the system
in which to view audit information (i.e., Security).
When finished configuring the filter options,
click the Refresh button. The
applicable audit information will begin being displayed and a progress
bar will indicate the record progress of the audit query. You can click
the Cancel button has to terminate
a long running query, if needed.
Modify the Audit Date From
and Through fields if you want
to view audit events for a particular date range.
NOTE: The system will not allow you to filter an audit query for greater
than a 12 month period. A warning icon will appear next to the Audit Date
From field when are range greater than 12 months has been entered. If
you mouse over the warning icon, a message will appear outlining the warning.
Select an Operator
to view audit events for a specific user.
In the Failed field, select Yes
or No if you want to specify whether
to just view audit events that failed, or did not fail. Leaving this field
blank shows both events that failed and events that did not fail.
The Metadata and Value fields allow you to select
addition data items to filter on. Select a Metadata
item, and enter a corresponding Value
for that item, if applicable.
NOTE: The system will not allow you to use less than three characters
in the Value field when utilizing the Contains or Starts With search type
when configuring metadata. A warning icon will blink next to the Value
field when it contains less than three digits. If you mouse over the warning
icon, a message will appear outlining the warning.
In the Application field, select the particular
Application (Clinical, Health
Portal, Practice Manager) you would like to view audit events for. Leaving
this field blank will display audit events for all applications.
Select an Event
if you want to specify a certain audit type (i.e., deleted items) to be
displayed.
Select a Functional
Area if you want to specify a particular area within the system
in which to view audit information (i.e., Security).
Select a Group
if you want to specify a particular group of audit events to be displayed
(i.e., Immunizations).
When finished configuring the filter options,
click the Refresh button. The
applicable audit information will begin being displayed and a progress
bar will indicate the record progress of the audit query. You can click
the Cancel button has to terminate
a long running query, if needed.
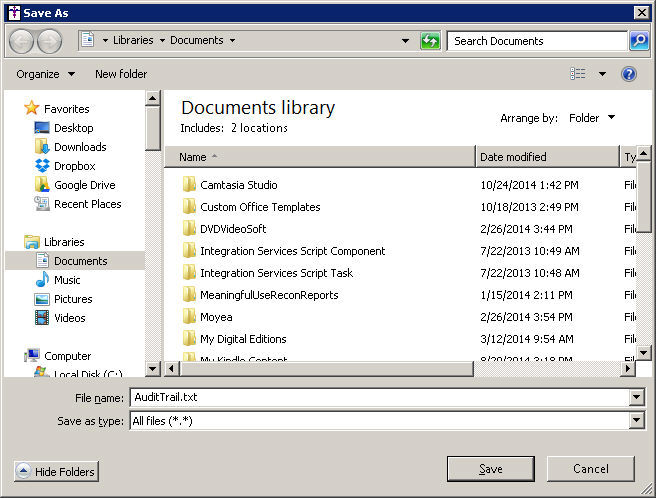
To save the configure audit information to a tab-delimited
text file, and thereby have the ability to print it, click the Save
to File button. In the Save As dialog, browse to where you want
to save the file (it defaults to My Documents), and then click the Save button. For best results it is
recommended that the saved file be opened in Excel which will format the
file in an easy to print manner. Once the file is opened it can be printed.
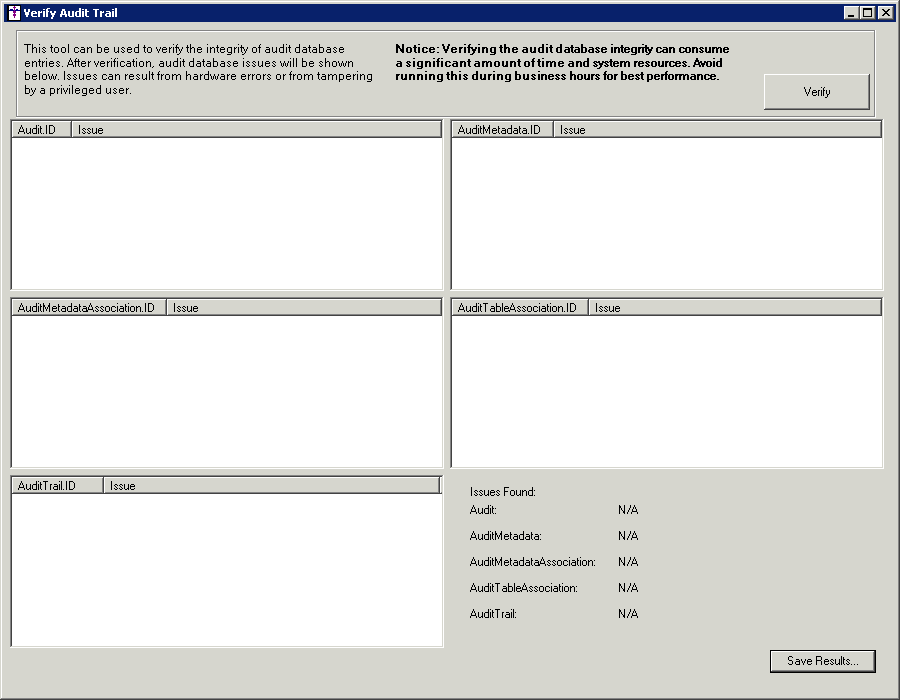
The Verify Audit
Trail button in the Audit Trail dialog allows you to access the
Verify Audit Trail dialog where you can verify the integrity of the audit
database entries. To do this click the Verify
button. After the verification tool has been run any issues resulting
from hardware errors or from database tampering will be listed below.
Click the Save Results button
to save a log file of the results.
When finished, click the Close button to exit the Audit Trail dialog.