ChartMaker®
Clinical is a template driven system. These templates contain disease
management service items and preventive measures as well as wellness guidelines
within them. Examples of these items include vital signs.
Items can be added to the template for use in patient documentation.
They can be updated through the Template
Editor.
Documenting that a preventive or disease management service has been
performed is done through patient notes.
A chart note is made for a patient by using one of the templates. You
can document that items were performed through typing text, clicking on
Checklist or Pick List items, using Voice Recognition software, or through
Scanning.
Items such as vital signs, procedures, diagnosis and immunizations are
stored as discreet data in the database for later data retrieval or reporting.
An example of how to add in a blood pressure for preventive or disease
management is given below.
Open ChartMaker® Clinical.
Open a patient chart
Go to the folder you want to make a note in.
Go to the right side of the screen and click the Note tab.
Click Instant Note.
Click the template you want to use.
Click in the Systolic Blood Pressure Numeric field then either type in a number or hold the up/down arrow until you reach the appropriate number.
Click in the Diastolic Blood Pressure Numeric field then either type in a number or hold the up/down arrow until you reach the appropriate number.
An example of how a preventive service alert would be resolved and no longer appear to the provider, once the service is ordered, is shown below.
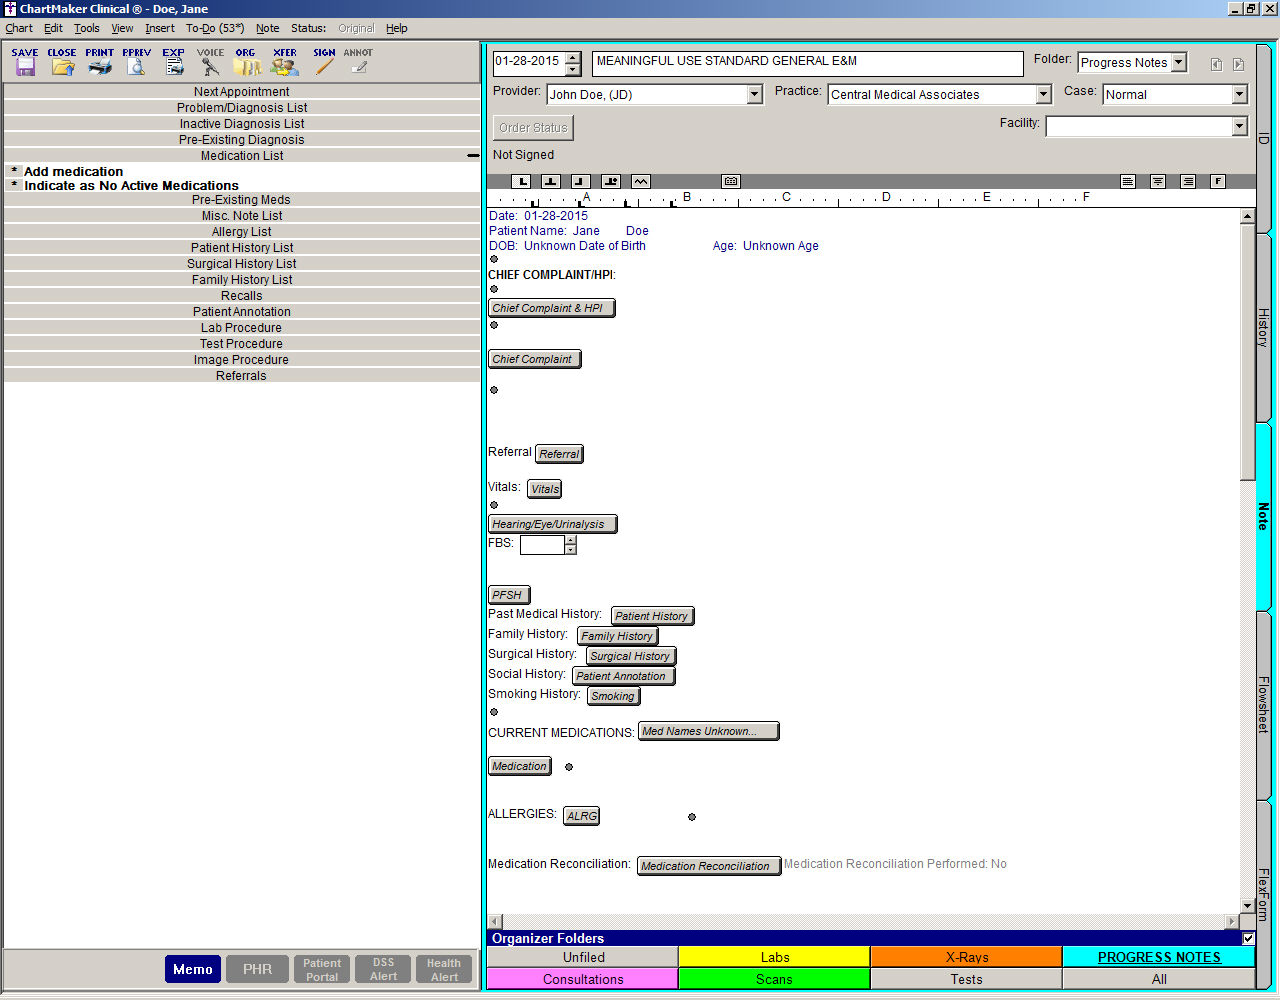
The provider opens Jane D. Patient chart, starts
a new note and is alerted that an outstanding item needs attended to (in
this case we will use a mammogram as an example). As seen in the screen
shot below the Health Alert button is Yellow which serves as the alert
indication. If no alert existed the button would be gray.
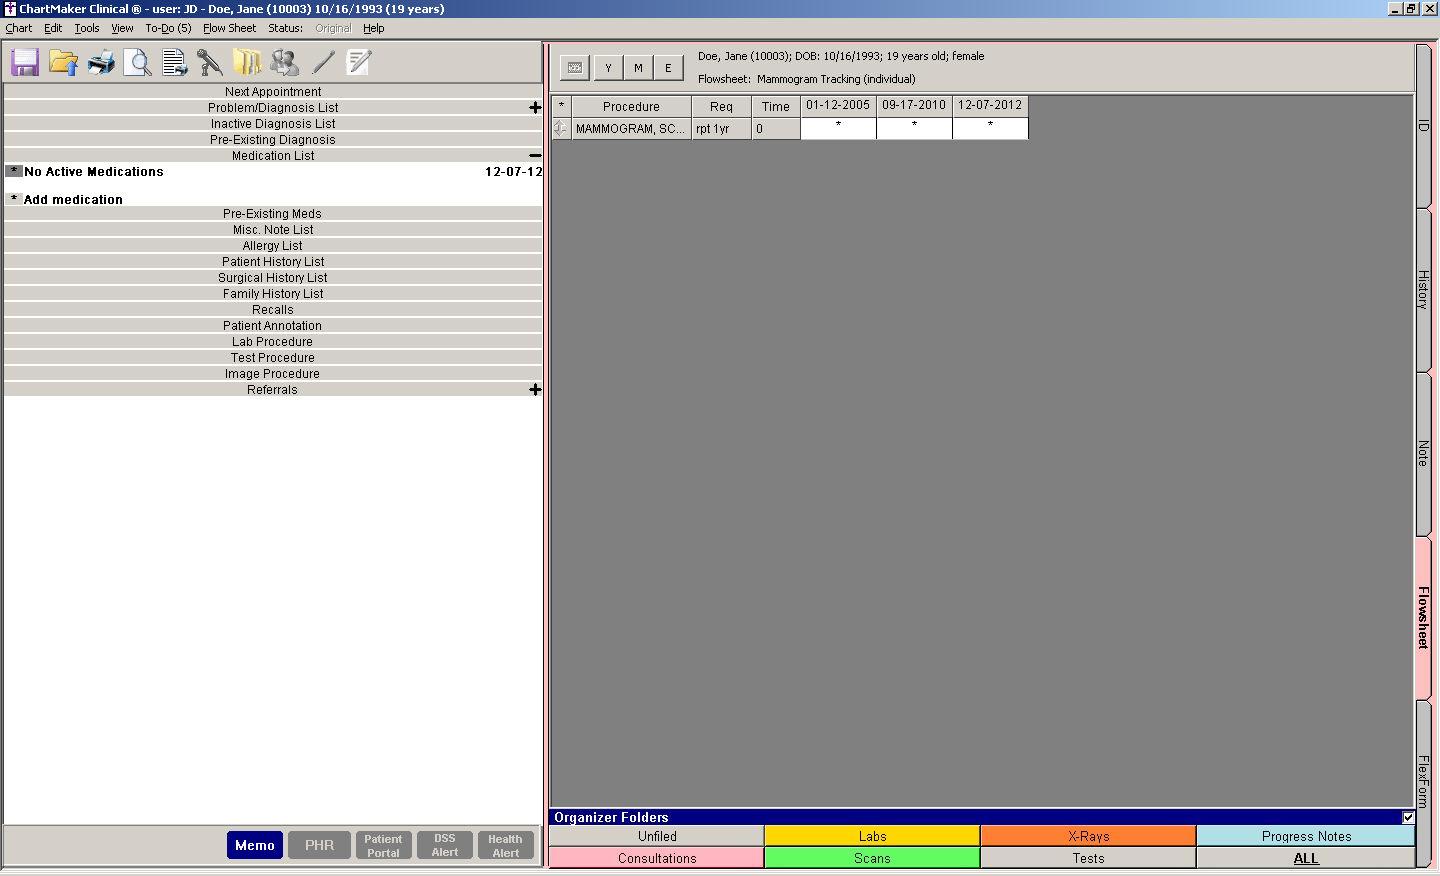
The provider then opens the patient’s flow sheet
to see the status of whichever procedures, immunizations, vital signs,
adult preventive care, or other practice area that provider tracks. In
the example below, a flow sheet entitled Mammogram Tracking is opened.
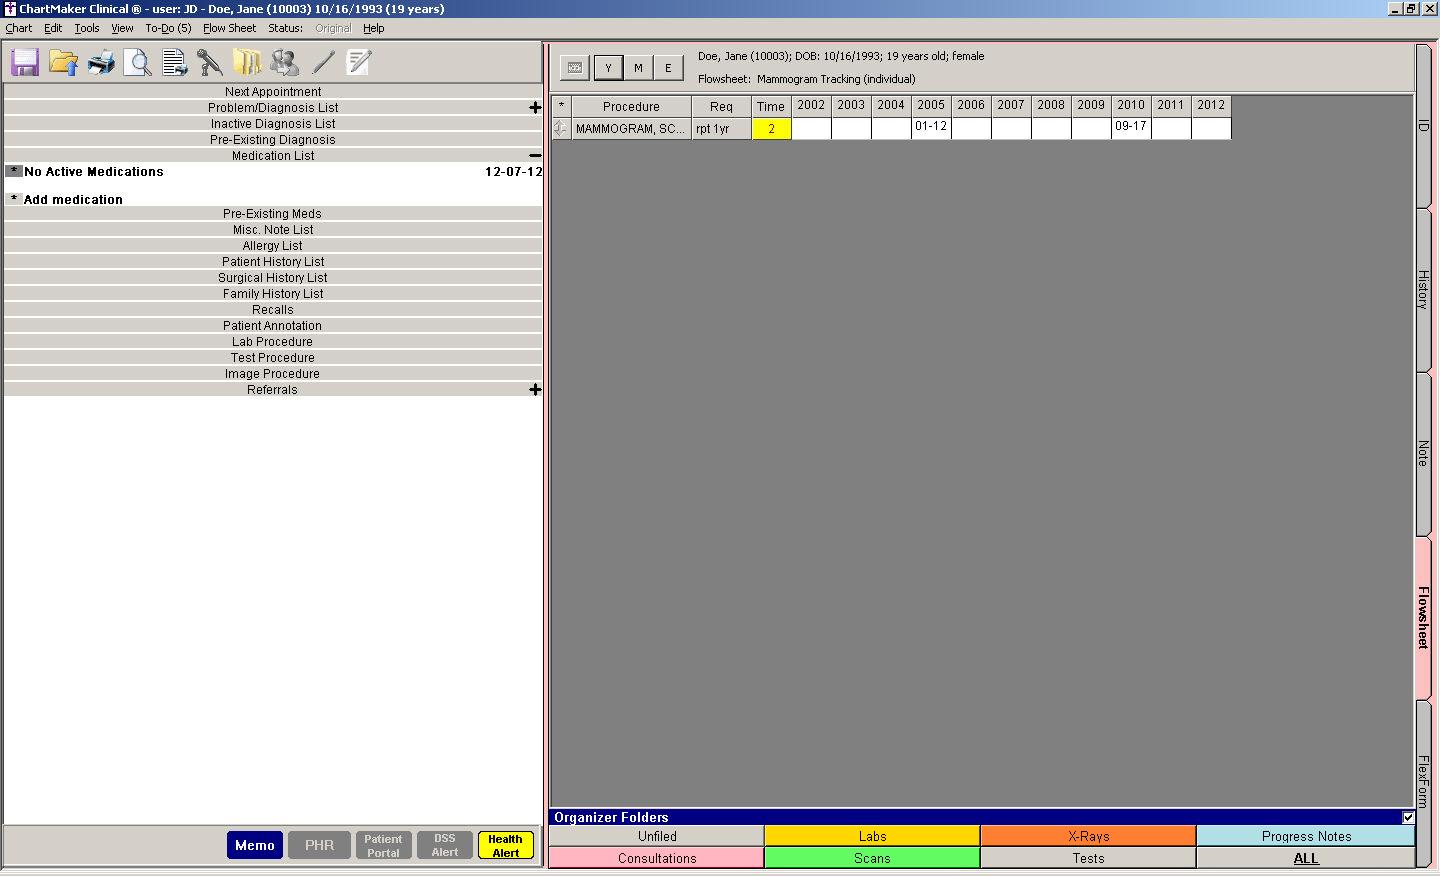
The flow sheet above displays the time period required – repeat every
year, shown as rpt 1yr in the Req column. The
time elapsed is 2 years, highlighted in yellow indicating that she is
due for that procedure now. Also displayed is when this procedure was
performed, in this case the procedure mammogram screening was performed
twice: once on January 12, 2005 and once on September 17, 2010.
The provider now orders a mammogram procedure
from the procedure checklist as shown below:
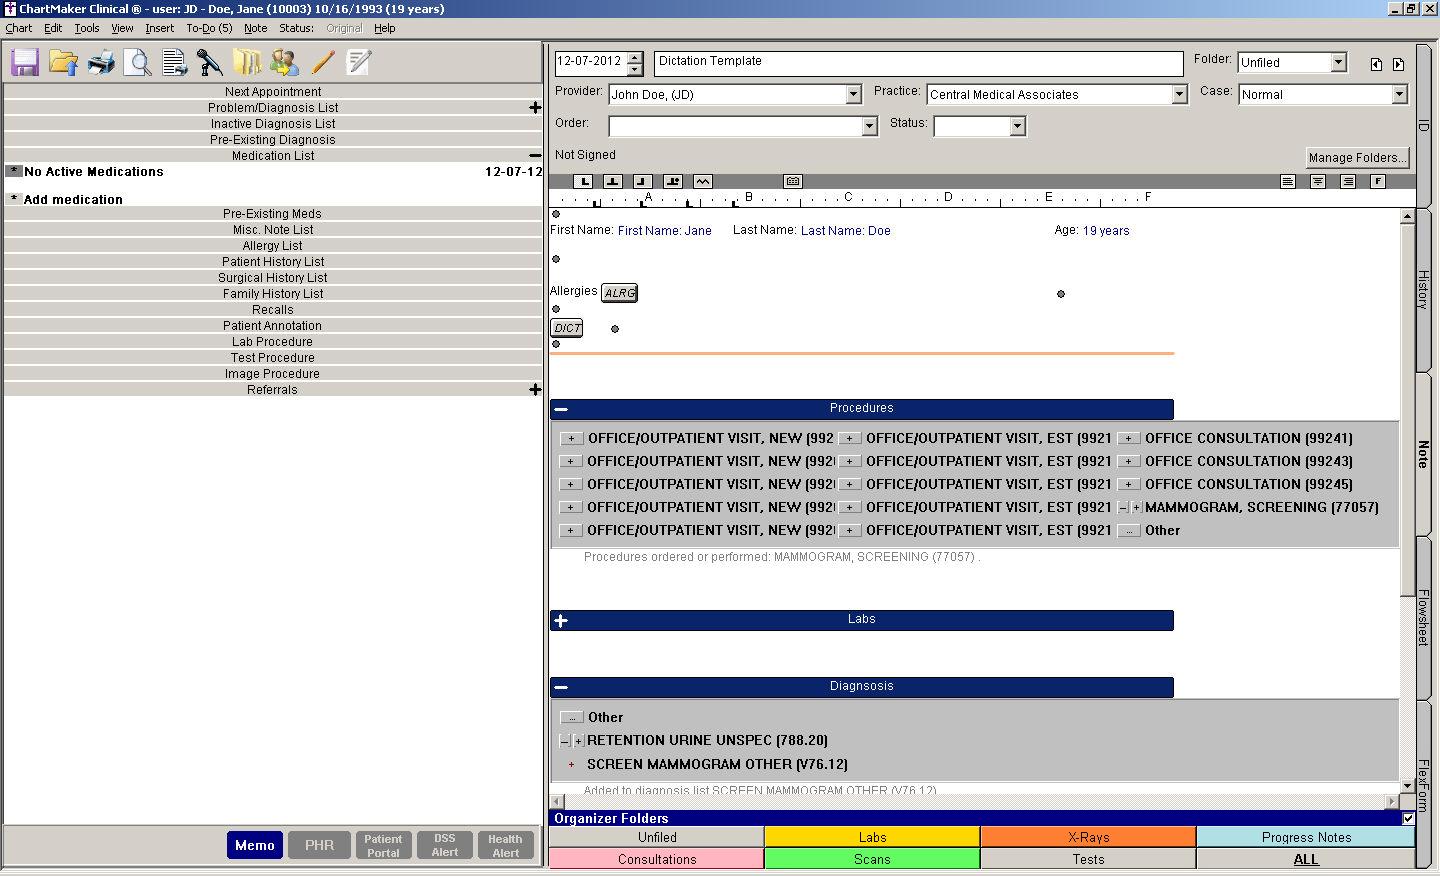
The provider saves the note with this new procedure
ordered and the Health Alert button inactivates, changing from yellow
to gray, as shown above.
Going back to the flow sheet, as shown below,
we can see that in addition to the Health Alert button turning gray, the
Time period in the flow sheet is no longer highlighted in yellow because
the procedure has been ordered. Also in the screen below the “E” for event
button has been pressed showing event occurrences (the other Y & M
buttons would display data by year or month) and the asterisk shows when
the procedure was done.
For more detailed information on creating and modifying chart notes, see The Note Tab help.